Code author: jhkwakkel <j.h.kwakkel (at) tudelft (dot) nl>
This module contains helper functions related to scenario discovery. These functions can be used to transform a classification tree into a list of boxes, identical to those returned by the PRIM algorithm. There are also functions here for calculating the scenario discovery metrics coverage and density.
Function for calculating the coverage and density scenario discovery metrics.
| Parameters: |
|
|---|---|
| Returns: | The list of PRIM boxes with coverage and density added to each box as additional attribute. |
Coverage and density are given below:
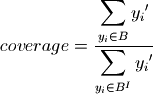
where  if
if  and
and  otherwise.
Coverage is the ratio of cases of interest in a box to the total number of cases of interests. It thus provides insight into which fraction of cases of interest is in a particular box.
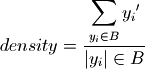
where if and
otherwise, and  is the
cardinality of
is the
cardinality of  .
.
Density is the ratio of the cases of interest in a box to the total number of cases in that box. density is identical to the mean in case of a binary classification. For more detail on these metrics see Bryant and Lempert (2010)
Function that turns a classification tree into prim boxes, including the scenario discovery metrics.
| Parameters: |
|
|---|---|
| Returns: | a list of prim boxes. |
Recursive function for finding branches in a tree.
| Parameters: |
|
|---|---|
| Returns: | A list of branches. Each branch is in turn a list, starting from the distribution in the leaf, back to the root of the tree. For each split in the tree, it gives the name of the variable, and the split condition. The split condition is given as a string. So. A branch is given from the bottom up. |
example of use
>>> tree = analysis.orangeFunctions.tree(data, classify_function)
>>> startNode = tree.tree
>>> branches = find_branches(startNode, ["root", ""])