Code author: jhkwakkel <j.h.kwakkel (at) tudelft (dot) nl>
This module provides functionality for generating various 3d graphs, using
mayavi.
-
graphs3d.envelopes3d(results, outcome, policy=None, logSpace=False, ymin=None, ymax=None)
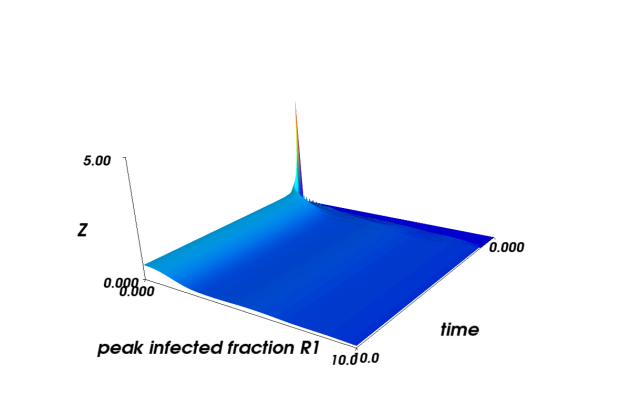
Function for making 3d envelopes. In contrast to the envelopes in
graphs, this version shows the density for every time step, instead
of only for the end state. Note that this function makes an envelope for
only 1 outcome. Moreover, it cannot plot the 3d envelopes for different
policies into the same figure Thus, for comparing different policies,
make separate 3d envelopes for each policy and put them side by side for
comparison.
| Parameters: |
- results – The return from perform_experiments().
- outcome – The name of outcome of interest for which you want
to make the 3d envelopes.
- policy – Optional argument, if provided, only for that particular
policy the envelope is calculated. It is recommended that
this argument is provided if there are indeed multiple
policies.
- logSpace – boolean, if true, the log of the input data is used
- ymin – if provided, lower bound for the KDE, if not,
ymin = np.min(results.get(outcome))
- ymax – if provided, lower bound for the KDE, if not,
ymax = np.max(results.get(outcome))
|
|---|
the following code snippet
>>> import expWorkbench.util as util
>>> data = util.load_results(r'100 flu cases.cPickle')
>>> outcome = 'deceased population region 1'
>>> policy = 'adaptive policy'
>>> envelopes3d(data, outcome=outcome, policy=policy)
generates the following mayavi scene. It can be further edited using the
mayavi pipeline
-
graphs3d.lines3d(results, outcomes, policy=None)
Function for making a 3d lines plot. This function will plot
the 2 supplied outcomes against each other over time. It will try
to use TIME if provided.
| Parameters: |
- results – The return from perform_experiments().
- outcome – The name of outcome of interest for which you want
to make the 3d lines.
- policy – Optional argument, if provided, only for that particular
policy the lines are visualized. It is recommended that
this argument is provided if there are indeed multiple
policies.
|
|---|
Code based on mayavi example
-
graphs3d.scatter3d(results, outcomes, policy=None)
Function for making a 3d scatter plots. This function will plot
the 3 supplied outcomes against each other over time. If the data
is a time series, end states will be used.
| Parameters: |
- results – The return from perform_experiments().
- outcomes – The names of the 3 outcomes of interest that are to be
plotted.
- policy – Optional argument, if provided, only for that particular
policy the scatter plot is generated. It is recommended
that this argument is provided if there are indeed multiple
policies.
|
|---|
-
graphs3d.envelopes3d_group_by(results, outcome, groupBy='policy', discretesize=None, logSpace=False, ymin=None, ymax=None)
Function for making 3d envelopes. In contrast to the envelopes in
graphs, this version shows the density for every time step, instead
of only for the end state. Note that this function makes an envelope for
only 1 outcome. This envelopes will group the results based on the
specified uncertainty. The user can supply a discretesize function
to control the grouping in case of parameterUncertainties. This function
will make a separate envelope for each group.
| Parameters: |
- results – The return from run experiments().
- outcome – Specify the name of outcome of interest for which you want to make
the 3d envelopes.
- groupBy – The uncertainty to group by. (default=policy)
- discretesize – a discretesize function to control the grouping in case of parameterUncertainties
- logSpace – Boolean, if true, the log of the input data is used
- ymin – If provided, lower bound for the KDE, if not, ymin = np.min(results.get(outcome))
- ymax – If provided, lower bound for the KDE, if not, ymax = np.max(results.get(outcome))
|
|---|