'''
Created on 16 okt. 2012
@author: localadmin
'''
from expWorkbench import load_results
import numpy as np
import matplotlib.pyplot as plt
from analysis.plotting import lines
from analysis import plotting
results = load_results(r'.\data\2000 flu cases no policy.bz2')
experiments, outcomes = results
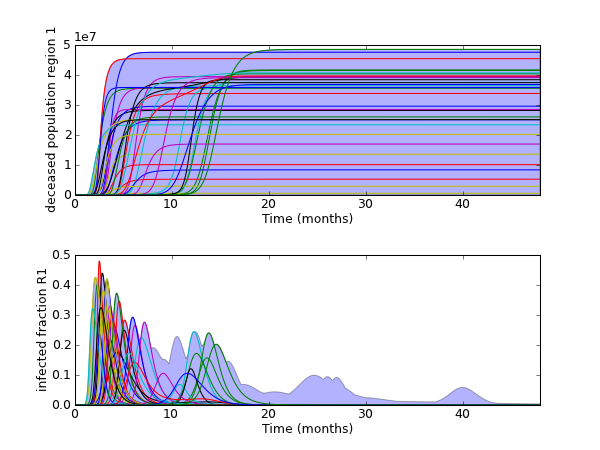
# get indices with of worst runs in terms of deaths and max fraction of
# population that is ill at any given point in time
deaths = outcomes['deceased population region 1'][:, -1]
peak = np.max(outcomes['infected fraction R1'], axis=1)
deaths = [(deaths[i], i) for i in range(deaths.shape[0])]
deaths = sorted(deaths, reverse=True)
death_indices = [death[1] for death in deaths]
peak = [(peak [i], i) for i in range(peak.shape[0])]
peak = sorted(peak, reverse=True)
peak_indices = [element[1] for element in peak]
# combine the top 20 of both
indices = death_indices[0:20]
[indices.append(entry) for entry in peak_indices[0:20]]
# how much can we nest....
# we first do the set to remove duplicates, next we cast it to a list
# so we can sort it. The sorting might be superfluous.
indices = sorted(list(set(indices)))
indices = np.asarray(indices)
#lets modify the default time label
plotting.TIME_LABEL = "Time (months)"
# visualize the results on top of an envelope
# do not show titles for the axes
lines(results,
experiments_to_show=indices,
show_envelope=True,
titles=None)
plt.savefig("./pictures/advanced_lines.png", dpi=75)