Jan H. Kwakkel and Gonenc Yucel
This paper is available online at Journal of the Knowledge Economy
Link: http://link.springer.com/article/10.1007%2Fs13132-012-0128-1
Recent contextual developments constitute a backdrop of change for the Dutch electricity system. Institutional change driven by liberalization, changing economic competitiveness of the dominant fuels, new technologies, and changing end-user preferences regarding electricity supply are some examples of these developments. This paper explores plausible transition trajectories in the face of these developments given technological uncertainty about investment and operating costs, and fuel efficiency of various alternative technologies; political uncertainty about future CO2 abetment policies such as emission trading; and socio-economic uncertainty about fuel prices, investment decisions of suppliers, and load curves. Various alternative developments for these uncertainties are specified. The consequences of each of these alternative developments is assessed using an agent-based model of the Dutch electricity system. The outputs are analyzed using various data-mining and data visualization techniques in order to reveal arch-typical transition trajectories and their conditions for occurring. Policy recommendations are derived from this. The results indicate that most transition trajectories point towards a future energy supply system that is reliant on clean coal and gas. Under the explored uncertainties, only rarely a transition to renewables occurs. The various sustainable energy support programs appear to be ineffective in steering the energy supply system towards a more sustainable mode of functioning across the various uncertainties.
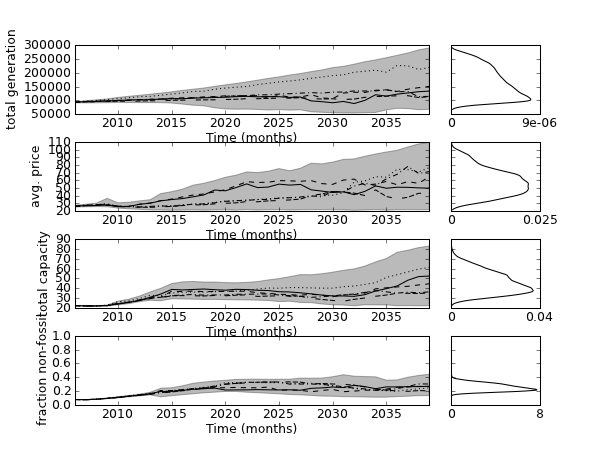
The figure shows the envelope of the outcomes of 50.000 experiments and a few randomly selected runs for the total generation, total capacity, the average price, and the fraction of non-fossil generation. With respect to this last indicator, we observe that in none of the runs, this fraction surpasses 0.5. That is, in all the runs, in 2100, the sustainable generation will be smaller than 50% of all the generated energy. Moreover, we observe that for most of the runs, the terminal value for the fraction is around 0.25. If we look at some of the individual runs, we observe that there is even a run where the sustainable generation rises until around 2025, after which is even declines again In all, this paints a rather grim picture for the potential of a transition towards a more sustainable energy generation system.
'''
Created on Aug 21, 2012

@author: jhkwakkel
'''
from __future__ import division
import matplotlib.pyplot as plt
import numpy as np

from expWorkbench import load_results
from analysis.plotting import lines, envelopes
from analysis.b_and_w_plotting import set_fig_to_bw

# load results
results = load_results(r'.\data\JotKE 50000.bz2')
experiments, outcomes =  results

# pre process the data
new_outcomes = {}
new_outcomes['total capacity'] = outcomes['capa central'] + outcomes['capa decentral']
new_outcomes['total generation'] = outcomes['gen central'] + outcomes['gen decentral']
new_outcomes['total fossil'] = outcomes['central coal'] + outcomes['central gas'] + outcomes['decentral gas']
new_outcomes['total non-fossil'] = new_outcomes['total generation'] - new_outcomes['total fossil']
new_outcomes['avg. price'] = outcomes['avg price']
new_outcomes['fraction non-fossil'] = new_outcomes['total non-fossil'] / new_outcomes['total generation']

# create the time dimension including 2006 as a starting year
time = np.arange(0, new_outcomes['avg. price'].shape[1])+2006
time = np.tile(time, (new_outcomes['avg. price'].shape[0],1))
new_outcomes["TIME"] = time

results = (experiments, new_outcomes)

# create a lines plot on top of an envelope
fig, axes_dict = lines(results,
                       density='kde',
                       outcomes_to_show=['total capacity',
                                         'total generation',
                                         'avg. price',
                                         'fraction non-fossil'],
                       show_envelope=True,
                       experiments_to_show=np.random.randint(0, new_outcomes['avg. price'].shape[0], (5,)),
                       titles=None,
                       )

# use the returned axes dict to modify the ylim on one of the outcomes
axes_dict['fraction non-fossil'].set_ylim(ymin=0, ymax=1)
axes_dict['fraction non-fossil_density'].set_ylim(ymin=0, ymax=1)

# transform the figure to black and white
set_fig_to_bw(fig)

plt.savefig("./pictures/jotke_envelopes.png", dpi=75)