Caner Hamarat, Jan Kwakkel, Erik Pruyt
This paper is available online at Technological Forecasting & Social Change
Link: http://www.sciencedirect.com/science/article/pii/S004016251200248X
Developing strategies, or policies, that automatically adapt to changing conditions is called adaptive decision-making, respectively adaptive policy-making. In this paper, we propose an iterative computational model-based approach to support adaptive decision-making under deep uncertainty. This approach combines an adaptive policy-making framework with a computational approach to generate and explore thousands of plausible scenarios using simulation models, data mining techniques, and robust optimization. The proposed approach, which is very useful for Future-Oriented Technology Analysis (FTA) studies, is illustrated on a policy-making case related to energy transitions. This case demonstrates how the performance of a policy can be improved iteratively by exploring its performance across thousands of plausible scenarios, identifying problematic subsets that require improvement, identifying adaptive high leverage actions with which the adaptive policy needs to be extended until a satisfying dynamic adaptive policy is found for the entire ensemble of plausible scenarios. The approach is not only appropriate for energy transitions; it is also appropriate for any long-term structural and systematic transformation characterized by dynamic complexity and deep uncertainty.
In this paper, we propose an iterative model-based approach for designing adaptive policies that are robust under deep uncertainty. The approach starts from a conceptualization of the decision problem and the identification of the key uncertainties. Next, an ensemble of models is developed that explicitly allows for the exploration of the uncertainties. The behavior of the ensemble is analyzed and troublesome or advantageous (combinations of) uncertainties are identified, stimulating policy design. Iteratively, the initial design is fine-tuned until there are no remaining troublesome (combinations of) uncertainties or the policy is deemed satisfactory based on other grounds. This approach thus explicitly uses the multiplicity of plausible futures for policy design, addressing one of the shortcomings of many traditional approaches and practices, i.e. the poor utilization of the potential to be prepared for uncertainties and surprises of future developments. The systemic characteristic of the proposed approach enables a holistic and systemic exploration of the future, which is of great importance in FTA.
The proposed approach, Adaptive Robust Design (ARD), is illustrated by means of a long-term policy-making case related to the transition of energy system toward sustainability. Energy systems are complex, their development over time is dynamically complex, and many aspects related to these systems and their future developments are deeply uncertain. Current attempts at steering the transition toward a more sustainable and cleaner configuration are static and may not be very effective and efficient in various futures, i.e. they may not be robust. This energy transition case is therefore used for illustrating how this approach could be used for policy-making, and more generally, decision-making under deep uncertainty.
The initial analysis starts without introducing any policy. As a next step, we have analyzed the initial results and designed a basic policy that is focused on promoting the decommissioning of the dominant non-renewable technology. This initial policy is called basic policy. However, the basic policy was not enough to promote transition toward sustainable future. According to the analysis on new results, there appeared two opportunities that can be benefited. One was related with dominant renewable technology and the other was related with economic development and costs. Thus, two adaptive strategies have been designed and added on top of the basic policy. Signposts for tracking specific information have been specified and critical values of signposts, which are triggers, have been identified in order to trigger the adaptive actions. In order to improve the performance of the adaptive strategies even further, the triggers are optimized using robust optimization. This new resulting policy was called optimized adaptive policy.
For a sustainable future, the renewable energies should be promoted and there should be a transition toward a more sustainable energy system. For this reason, we have used the total fraction of the renewable energies over the whole energy system as a performance indicator. For each policy, a wide range of uncertainties were explored and more than 9,000 runs were generated. The left side of the figure shows the envelope of the fraction of sustainable technologies over a time horizon of 100 years for each policy with a different color. Envelope can be understood as the upper and lower bounds for the fraction over all the runs (>9000). On the right side of the figure, the density estimates for the end states of the renewable fraction is shown. Each policy is represented with a different color. This method helps us understand where the runs are mainly concentrated.
Legend: color codes for different policies
| No Policy | Basic Policy | Optimized Adaptive Policy |
|---|---|---|
| Blue line | Green line | Red line |
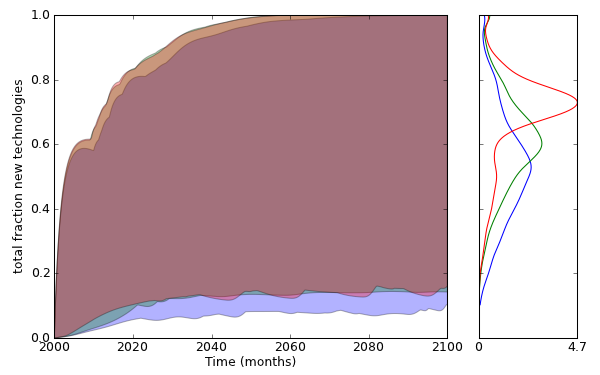
As shown on the right side (gaussian kernel density estimates), there is a considerable improvement by introducing the basic policy. The blue line stays below the other two policies. It shows that the adaptive policy ensemble, although hardly improving the extremes, outperforms the basic policy and no policy ensembles on this key performance indicator: the adaptive policy is a better guarantee for a successful transition under deep uncertainty, without forcing a transition to new technologies upon situations that do not require a transition to take place (e.g. in case of a cheap and environmentally friendly dominant technology) or for which a transition would be overly expensive.
'''
Created on 16 nov. 2012

@author: chamarat
'''

import matplotlib.pyplot as plt

from expWorkbench import load_results
from analysis.plotting import envelopes
import analysis.plotting_util as plottingUtil

# force matplotlib to use tight layout
# see http://matplotlib.sourceforge.net/users/tight_layout_guide.html
# for details
plottingUtil.TIGHT= True

#get the data
results = load_results(r'.\data\TFSC_corrected.bz2')

# make an envelope
fig, axesdict = envelopes(results,
                outcomes_to_show=['total fraction new technologies'],
                group_by='policy',
                grouping_specifiers=['No Policy',
                                     'Basic Policy',
                                     'Optimized Adaptive Policy'],
                legend=False,
                density='kde', fill=True,titles=None)

# set the size of the figure to look reasonable nice
fig.set_size_inches(8,5)

# save figure
plt.savefig("./pictures/policy_comparison.png", dpi=75)